Content for TS 23.435 Word version: 19.3.0
0…
4…
5…
7…
9…
9.4…
9.5…
9.6…
9.7…
9.8…
9.9…
9.10…
9.11…
9.12…
9.13…
9.14…
9.15…
9.16…
9.17…
9.18…
A…
9.7 Network slice related performance and analytics monitoring
9.7.1 General
9.7.2 Procedure
9.7.2.1 Network slice related performance and analytics monitoring job creation request
9.7.2.2 Network slice related performance and analytics report subscription and report
9.7.2.3 Multiple slices related performance and analytics consolidated report request
9.7.3 Information flows
9.7.4 APIs
9.7.4.1 General
9.7.4.2 SS_NSCE_PerfMonitoring API
9.7.4.3 SS_NSCE_PerfReportSubscription API
9.7.4.4 SS_NSCE_PerfReport API
9.7.4.5 SS_NSCE_MultiSlicePerfReport API
...
...
9.7 Network slice related performance and analytics monitoring p. 56
9.7.1 General p. 56
The NSCE server supports the end to end network slice related performance and analytic monitoring capability exposure. The NSCE server identifies which data are needed, collects the data from different data sources (e.g., the OAM system, the Core Network or the VAL end users), performs the data organizations and aggregations and expose the processed data to VAL servers for monitoring. Following clauses are for the procedures, information flows and APIs for Network slice related performance and analytics monitoring request and Network slice related performance and analytics reporting respectively. The procedure in clause 9.7.2.1 is for task creation of the network slice performance and analytics monitoring. The procedure in clause 9.7.2.2 is for the performance and analytics data retrieving when the data is available. The procedure in clause 9.7.2.3 is for multiple network slices performance and analytics consolidated report.
9.7.2 Procedure p. 56
9.7.2.1 Network slice related performance and analytics monitoring job creation request p. 56
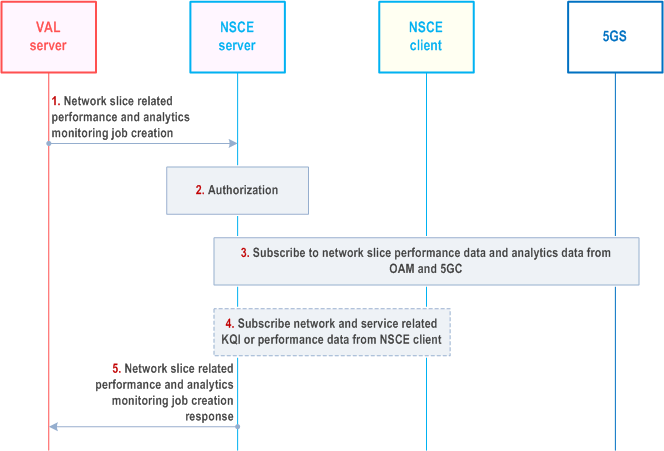
For network slice related performance and analytics monitoring job creation capabilities exposed to the VAL server, the VAL server triggers the procedure by sending the network slice related performance and analytics monitoring job creation request to NSCE server as Figure 9.7.2.2-1 shows:

Step 1.
The VAL server sends a request to NSCE server to create the Network slice related performance and analytics monitoring job to collect the desired service/VAL service specific performance and analytics data, the detailed content of the reported data depends on the type of the VAL services. The required end-to-end network slice related data performance data are indicated by Perflist IE as described in Table 9.7.3.2-1.
Step 2.
The NSCE server shall check if the VAL server is authorized to request the network slice performance and analytics data monitoring job creation.
Step 3.
NSCE server determines the requested data needed to collect from network side and collects the performance measurements and analytics data of network slice from 5GS. For OAM system, the APIs defined in clause 11.3 of TS 28.532 is utilized, e.g., packet delay, radio resource utilization. For CN functions, the APIs of Nnwdaf_AnalyticsInfo service defined in clause 7.3 of TS 23.288 is utilized, e.g., slice load level related network data analytics, slice load level related network data analytics.
Step 4.
Optionally, NSCE server retrieves the KQI data of services, the QoE data and the end user's information from NSCE client.
Step 5.
NSCE server responds to VAL server to inform the VAL server if the monitoring request is succeed.
9.7.2.2 Network slice related performance and analytics report subscription and report p. 57
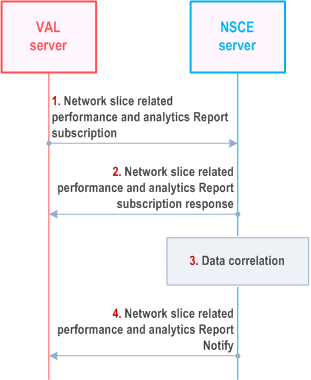
For network slice related performance and analytics result subscription and report, the VAL server triggers the procedure by sending the network slice related performance and analytics report subscription to NSCE server, the NSCE server reports the performance and analytics report after the subscription is succeed, as Figure 9.7.2.2-1 shows:

Step 1.
The VAL server subscribes to the required performance and analytics report.
Step 2.
The NSCE server response to the VAL server to indicate whether the report is successfully generated and ready.
Step 3.
NSCE server correlates the performance data of network slice instance, the analytics data of group of UEs and the KQI/QoE data to generate the performance data and analytics data report as required by VAL server.
Step 4.
NSCE server sends the performance report Notify to VAL server if the report is ready.
9.7.2.3 Multiple slices related performance and analytics consolidated report request p. 58
Based on preferred performance report request from the vertical applications, the consolidated performance report for dedicated service from multiple slices (PNI-NPN slice and PLMN slice of one network) can be offered to trusted third-party AF.
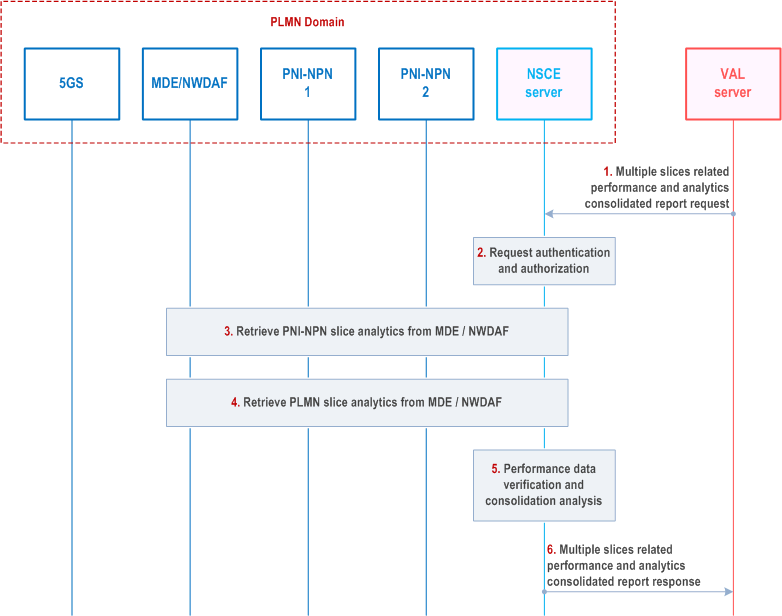
Figure 9.7.2.3-1 illustrates the procedure of multiple slices coordinated performance and analytics report service from VAL server to NSCE server.
Pre-conditions:
- The network slice enabler layer is capable to interact with PLMN 5GC or OAM system to handle slices of PLMN and its PNI-NPNs.
- PNI-NPNs are deployed as network slices of the PLMN.
- NSCE server has subscribed for MDE and NWDAF analytics for the managed slices of PLMN and PNI-NPN.

Step 1.
The VAL server initiates multiple slices related performance and analytics consolidated report request towards the NSCE server. The request includes VAL server ID, VAL service ID. The message also includes application key performance indicator (such as end-to-end delay, throughput, etc.) list and monitoring period.
Step 2.
Upon receiving the request from the VAL server to manage the network slice QoS monitoring report, the NSCE server makes authentication and authorization of the VAL server and if VAL server is not authorized, the NSCE server replies with failure response.
Step 3.
The NSCE server makes mapping from application ID that received from VAL server to slice identities (S-NSSAIs allocated in each network) and retrieves the PNI-NPN slice related status information from MDE/NWDAF, i.e. analytics data specified in TS 28.104 and TS 23.288.
Step 4.
The NSCE server retrieves the PLMN slice related performance information from MDE/NWDAF. The services of Nnwdaf_AnalyticsInfo service defined in clause 7.3 of TS 23.288 and analytics data as specified in TS 28.104 can be utilized.
Step 5.
The NSCE server verifies and analyses analytics data of network slice instances that is received from MDE/NWDAF about both PNI-NPN and PLMN slices, then NSCE server makes consolidated performance report among different kinds of network slices in specific period of time/location zone.
Step 6.
The NSCE server sends the multiple slices related performance and analytics consolidated report response towards VAL server including application key performance indicator (such as end-to-end delay, throughput, etc. ) list and monitoring period.
9.7.3 Information flows p. 59
9.7.3.1 General p. 59
The following information flows are specified for Network slice related performance and analytics monitoring:
- Network slice related performance and analytics monitoring job creation request and response,
- Network slice related performance and analytics monitoring report subscription,
- Network slice related performance and analytics monitoring report Notify,
- Multiple slices related performance and analytics consolidated report request and response.
9.7.3.2 Network slice related performance and analytics monitoring job creation request and response p. 60
Table 9.7.3.2-1 and Table 9.7.3.2-2 describe information elements for the network slice related performance and analytics monitoring job creation request and response between the VAL server and the NSCE server.
| Information element | Status | Description |
|---|---|---|
| VAL information | M | The information of the VAL server. |
| Performance Monitoring Request ID | M | Identifier of the performance and analytics monitoring job. |
| Performance and analytics monitoring metrics | M | The information of performance and analytics monitoring. |
| > VAL service identity | M | Identifier of the VAL service to be monitored. |
| > PerfList | M | The list of performance to be monitored. |
| >> PerfName | M | The name of the performance to be reported, e.g., the end to end round-trip time or the end to end network slice load. |
| > Network slice related Identifier(s) | O | Identifier(s) of the network slice to be monitored. |
| > StartTime | M | The start time point of the performance and analytics monitoring. |
| > EndTime | O | The end time point of the performance and analytics monitoring, If the EndTime IE is not included, it indicates that the performance and analytics monitoring will not stop until the monitoring request is released or updated. |
| Information element | Status | Description |
|---|---|---|
| Result | M | Indicates the success or failure of the performance and analytics monitoring request. |
| > Performance Monitoring Request ID | O
(see NOTE 1) | Identifier of the performance and analytics monitoring job. |
| > StartTime | O
(see NOTE 1) | The start time point of the performance and analytics monitoring. |
| > EndTime | O
(see NOTE 2) | The end time point of the performance and analytics monitoring, If the EndTime IE is not included, it indicates that the performance and analytics monitoring will not stop until the monitoring request is released or updated. |
| > Cause | O
(see NOTE 3) | Indicates the cause of VAL performance and analytics monitoring request failure. |
|
NOTE 1:
Shall be present if the result is success and shall not be present otherwise.
NOTE 2:
May only be present if the result is success.
NOTE 3:
Shall be present if the result is failure and shall not be present otherwise.
|
||
9.7.3.3 Network slice related performance and analytics report subscription p. 60
Table 9.7.3.3-1 and Table 9.7.3.3-2 describe information elements for Network slice related performance and analytics report subscription from the NSCE server to the VAL server.
| Information element | Status | Description |
|---|---|---|
| VAL information | M | The information of the VAL server. |
| > VAL server ID | M | The identifier of the VAL server. |
| Report ID | M | Identifier of performance and analytics results the report. |
| Report Information | M | The information of performance and analytics report retrieving. |
| > VAL service identity | M | Identifier of the VAL service of which the performance and analytics results are required. |
| > Network slice related Identifier(s) | O | Identifier(s) of the network slice. |
| > StartTime | M | The start time point of the performance and analytics report. |
| > EndTime | M | The end time point of the performance and analytics report. |
| > Notification time interval | O | The time interval that the network slice related performance and analytics report are supposed to be notified. |
| > PerfList | M | The list of performance to be reported. |
| >> PerfName | M | The name of the performance to be reported. |
| Information element | Status | Description |
|---|---|---|
| Result | M | Indicates the success or failure of the performance and analytics subscription. |
| > Report ID | O
(see NOTE 1) | Identifier of the performance and analytics report Id. |
| > Cause | O
(see NOTE 2) | Indicates the cause of VAL performance and analytics subscription failure. |
|
NOTE 1:
Shall be present if the result is success and shall not be present otherwise.
NOTE 2:
Shall be present if the result is failure and shall not be present otherwise.
|
||
9.7.3.4 Network slice related performance and analytics report Notify p. 61
Table 9.7.3.4-1 and Table 9.7.3.4-2 describe information elements for Network slice related performance and analytics report Notify from the NSCE server to the VAL server.
| Information element | Status | Description |
|---|---|---|
| VAL information | M | The information of the VAL server. |
| > VAL server ID | M | The identifier of the VAL server. |
| > Network slice related performance and analytics report | M | Network slice related performance and analytics report as defined in Table 9.7.3.4-2. |
| Information element | Status | Description |
|---|---|---|
| Report ID | M | Identifier of the report. |
| PerfResultFile | CM
(see NOTE 1) | PerfResultFile contains one or more PerfResult. |
| > PerfResult | CM | Information element containing the VAL service identity or S-NSSAI followed by a list of result values for the aggregated or analyzed network slice related performance. |
| > VAL service identity | M | Identifier of the VAL service of which the performance and analytics results are reported. |
| > Network slice related Identifier(s) | O | Identifier(s) of the network slice. |
| > ResultsValueList | List of ResultsValue. | |
| >> ResultsValue | M | Information element containing the perfName and perfValue. |
| >>> PerfName | M | The name of the performance to be reported. |
| >>> PerfValue | M | The corresponding value of the monitored performance. |
| Failure response | CM
(see NOTE 2) | Indicates that network slice related performance and analytics results reporting failed. |
| > Cause | CM
(see NOTE 2) | Indicates the cause of network slice related performance and analytics results report failure. |
|
NOTE 1:
Information element shall be present when the network slice related performance and analytics results retrieving is successful.
NOTE 2:
Information element shall be present when the network slice related performance and analytics results retrieving is failure.
|
||
9.7.3.5 Multiple slices related performance and analytics consolidated report request and response p. 62
Table 9.7.3.5-1 and Table 9.7.3.5-2 describe information elements for the multiple slices related performance and analytics consolidated report request and response between the VAL server and the NSCE server.
| Information element | Status | Description |
|---|---|---|
| VAL information | M | The information of the VAL server. |
| Performance Monitoring Request ID | M | Identifier of the performance and analytics monitoring. |
| Performance and analytics monitoring metrics | M | The information of performance and analytics monitoring. |
| > VAL service identity | M | Identifier of the VAL service to be monitored. |
| > PerfList | M | The list of performance to be monitored. |
| >> PerfName | M | The name of the performance to be reported, e.g., the end to end round-trip time or the end to end network slice load. |
| > Network slice related Identifier(s) | O | Identifier(s) of the network slice to be monitored. |
| > StartTime | M | The start time point of the performance and analytics monitoring. |
| > EndTime | M | The end time point of the performance and analytics monitoring. |
| > Report ID | M | Identifier of performance and analytics report. |
| Information element | Status | Description |
|---|---|---|
| Result | M | Indicates the success or failure of the performance and analytics monitoring request. |
| > StartTime | O
(see NOTE 1) | The start time point of the performance and analytics monitoring. |
| > EndTime | O
(see NOTE 1) | The end time point of the performance and analytics monitoring, If the EndTime IE is not included, it indicates that the performance and analytics monitoring will not stop until the monitoring request is released or updated. |
| > Report ID | O
(see NOTE 1) | Identifier of the report. |
| > VAL service identity | O
(see NOTE 1) | Identifier of the VAL service of which the performance and analytics results are reported. |
| >> Network slice related Identifier | O
(see NOTE 1) | Identifier of the network slice. One VAL service can be offerred on one or more network slices. |
| >>> ResultsValue | O
(see NOTE 1) | Information element containing the perfName and perfValue. |
| >>>> PerfName | O
(see NOTE 1) | The name of the performance to be reported. |
| >>>> PerfValue | O
(see NOTE 1) | The corresponding value of the monitored performance. |
| > Cause | O
(see NOTE 2) | Indicates the cause of VAL performance and analytics monitoring request failure. |
|
NOTE 1:
Shall be present if the result is success and shall not be present otherwise.
NOTE 2:
Shall be present if the result is failure and shall not be present otherwise.
|
||
9.7.4 APIs p. 63
9.7.4.1 General p. 63
Table 9.7.4.1-1 and Table 9.7.4.1-2 illustrate the API for network slice related performance and analytics monitoring.
| API Name | API Operations | Operation Semantics | Consumer(s) |
|---|---|---|---|
| SS_ | Perf_Monitoring_Request | Request /Response | VAL server |
| API Name | API Operations | Operation Semantics | Consumer(s) |
|---|---|---|---|
| SS_ | Perf_ PerfReport_Subscription | Subscription/response | VAL Server |
| API Name | API Operations | Operation Semantics | Consumer(s) |
|---|---|---|---|
| SS_ | Perf_Report | Notify | VAL Server |
| API Name | API Operations | Operation Semantics | Consumer(s) |
|---|---|---|---|
| SS_ | Multi_Slice_Perf_Report | Request /Response | VAL Server |
9.7.4.2 SS_NSCE_PerfMonitoring API p. 64
API operation name:
Perf_Monitoring
Description:
The consumer requests to monitor network slice related performance and analytics.
Known Consumers:
VAL server.
Inputs:
See Table 9.7.3.2-1.
Outputs:
See Table 9.7.2.2-2.
See clause 9.7.2.1 for details of usage of this operation.
9.7.4.3 SS_NSCE_PerfReportSubscription API p. 64
API operation name:
Perf_Result_Reporting
Description:
The consumer requests to report network slice related performance and analytics.
Known Consumers:
VAL server.
Inputs:
See Table 9.7.3.3-1.
Outputs:
See Table 9.7.3.3-2.
See clause 9.7.2.2 for details of usage of this operation.
9.7.4.4 SS_NSCE_PerfReport API p. 64
API operation name:
Perf_ Report
Description:
The consumer get notify of network slice related performance and analytics report.
Known Consumers:
VAL server.
Inputs:
See Table 9.7.3.4-1.
Outputs:
See Table 9.7.3.4-2.
See clause 9.7.2.2 for details of usage of this operation.
9.7.4.5 SS_NSCE_MultiSlicePerfReport API p. 64
API operation name:
Multi_Slice_Perf_Report
Description:
The consumer requests to get multiple slices related performance and analytics consolidated report.
Known Consumers:
VAL server.
Inputs:
See Table 9.7.3.5-1.
Outputs:
See Table 9.7.3.5-2.
See clause 9.7.2.3 for details of usage of this operation.