Content for TR 22.801 Word version: 12.0.0
C Data application impact on real UMTS networks p. 17
Impact of PS signalling on the network
An analysis was obtained by monitoring network performance counters at urban RNCs of two different operators across multiple days. Network resource utilization, traffic, and signalling counters are analyzed.
Breakdown of DL power at the base station in Release 6
Figure C-1 is a graphic representation of downlink power utilization obtained on an UMTS Release 6 network consisting of about 600 cells. The measurements were conducted over a period of several weekdays (excludes weekends) during the time segments when traffic load is high - from 8 am to 10 pm in each of those days.
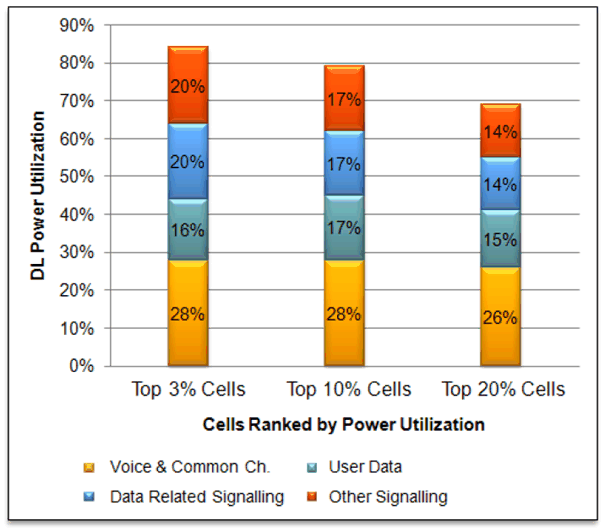
The statistics shown were calculated from network counters, which compute total energy used, yielding average power. The three categories of cells shown are based on maximum power utilization (e.g. "Top 10% Cells" refers to the 60 of the 600 cells that were most heavily utilized in terms of downlink transmit power). The percentages shown are relative to maximum DL power rated for the NodeB transmitters.
Transmit power is broken down into 4 categories as shown:
"Voice & Common Ch." includes power of common/broadcast channels (CPICH, SCH, SCCPCH (PCH, FACH), etc.), in addition to power required for carrying AMR voice frames
"User Data" refers to power consumed by user payload carrying packets
"Data Related Signalling" refers to power for control plane signalling associated with PS Data (non-voice) communication (call setup and in-call signalling), i.e. signalling related to setting up connections, scheduling user payload transmisisons, and connection state transitions direclty relatable to transmission of user payload data
"Other Signalling" refers to power for signalling associated with other services (Voice, SMS, Registrations, etc.)
R99 PS Data traffic is negligible in this network. Hence, power associated with R99 PS Data is not shown in Figure C-1.
Similarly, simultaneous PS and CS sessions constitute a small part of total traffic and they are captured under PS Data power.
Median CS call holding time is 60 - 80 seconds.
Some key data and findings are that, for the 10% of the cells that are the most heavily utilized,
34% of DL power is used for signalling
PS Signalling accounts for 50% signalling volume, 17% of DL power
Other signalling (registration, voice, SMS) accounts for another 17% of DL power
In summary, Data Related Signalling accounts for a very significant part of the signalling volume/impact. That impact is most pronounced in heavily utilized cells, where PS control signalling energy is equal or larger than user payload carrying energy.
Expected performance in Release 8
3GPP Release 8 (HSPA+) features aim to reduce PS Data related signalling .
Performance enhancing features introduced in Releases 7 and 8 define new UE connectivity states and allow for longer UE state transition timer settings, so that observed user activity patterns do not translate to parallel radio access network signalling associated with state transitions. These performance gains vary somewhat with timer settings and cell-to-cell (e.g., cell with predominantly high speed vehicular traffic vs. cell with predominantly indoor coverage).
Disproportionate impact of PS data communication
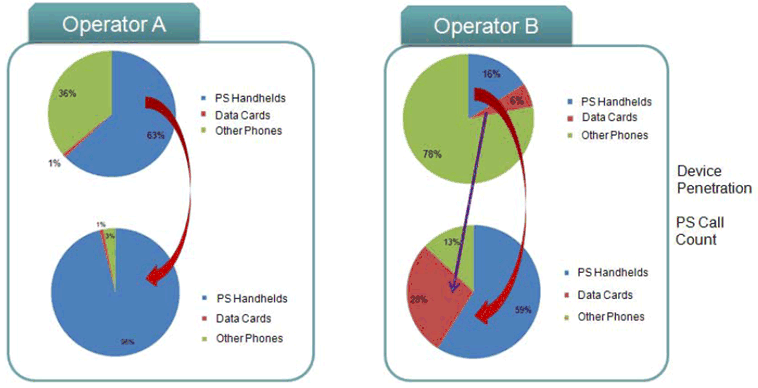
Another very relevant finding is that PS data communication activities have an impact on the UMTS that is higher than what the penetration of UEs designed for PS data applications in the network would suggest. In other words, as showed for example in Figure C-2, even a modest penetration (16%) of these UEs causes a very large presence (59%) of PS Calls. As the number of applications for data centric devices increases, and MTC device proliferation ramps up, the number of PS calls per UE is likely going to be increasing over time. For reference, the data presented in the Figure C-2 were collected in the spring of 2010.
Figure C-2 represents data collected using OSS performance monitoring tools in urban RNCs of selected networks: Operator A network segment monitored is comprised of 170 cells, and Operator B of 480 cells.
Field data statistics
The following results represent statistics for all devices in the selected RNC's collected over a 24-hour period.
Distribution of PS Call Duration
Figure C-3 shows statistical distribution of duration of PS calls generated by data communication UEs. PS call is defined by signalling messages from RRC/RAB setup and PDP activation, until RRC release.
As expected, many PS calls are "short". Additionally, sharp peak in call duration probablity at around 8 seconds in both networks seems to suggest battery energy saving techniques as a likely cause. Battery energy saving technique refers to the behaviour of some pre-R8 terminals, which, upon completion of a data exchange procedure, would autonomously go into a dormant state, thus releasing the RRC connection. While this UE implementation-dependent (proprietary) action of autonomously entering dormancy is advantageous in terms of conserving UE battery power, it would tend to increase the network impact since it may result in additional signalling due to connection release, only to be followed up shortly thereafter by connection re-establishment, as user activity resumes.
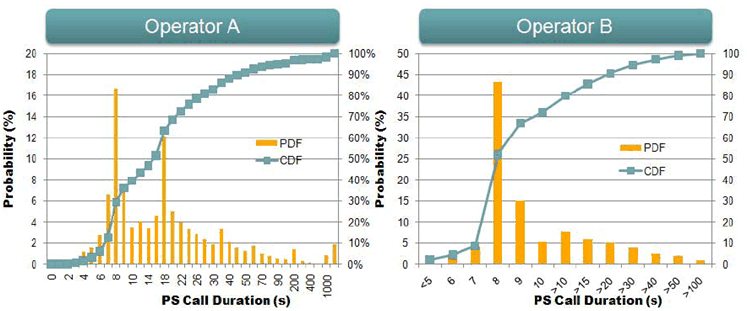
CDF: Cumulative Distribution Function
PDF: Probability Density Function
Data Volume of PS Calls
Figure C-4 shows distribution of data volume of PS calls. A large majority of calls is of very small volume: for both examples, a high percentage of calls transfer one kilobyte of data or less. This behaviour is typical of prevailing data applications such as push e-mail, social networking and instant messaging. Activities such as keep-alive messages, status reports, and polling contribute to such behaviour.
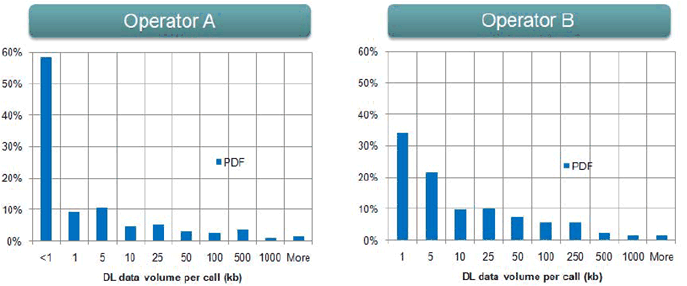
Note that the statistics shown are derived from several millions of PS calls taken over the two networks (one in Europe, another in North America) over several weekdays during March-May 2010 timeframe. Thus, the data represent a statistically significant sample for the timeframe in question.
Inter-arrival time of PS Calls
Figure C-5 shows distribution of inter-arrival times of PS Calls for a UE, compiled over many calls.
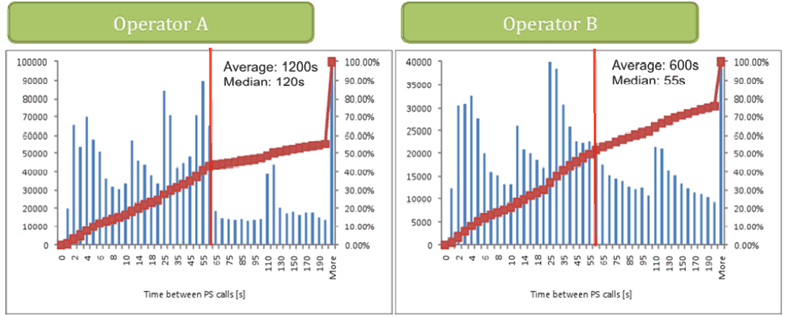
The red curve shows CDF of call inter-arrival time (secondary y axis). The purpose of the vertical red line is to show that ~50% of calls occur within 60 seconds of the previous one. This reflects typical user behaviour of closely spaced data communication sessions when using a data communication device actively. The plot additionally shows how "chatty" data applications traffic is.